Optimize your daily work
The Lean Data Kit
124 ready-to-use Excel and Power BI templates and dashboards, plus step-by-step guides for Lean Six Sigma, SPC and Minitab-style analysis. Stop building reports from scratch every time a project starts.
- OEE, SPC, FMEA, 8D, VSM and 119 more, preformulated
- 10 Power BI dashboards you refresh with your own data
- 3 click-by-click guides: stats, dashboards and DMAIC
Instant download · One-time payment · No subscription
Instant access!
📈
Data-driven decisions
Reports and analyses laid out to show the answer at a glance: clean charts, clear limits, numbers your boss reads in seconds.
⏱️
Results in 1 minute
Every template is preformulated. Paste your data and the complex math runs on its own: capability, OEE, RPN, forecasts.
⚙️
Automation that saves hours
No more building spreadsheets from zero, hunting templates online or fixing formulas that never worked.
What people are saying
Engineers, supervisors and analysts who stopped rebuilding the same reports every week.
★★★★★
Every Monday I rebuilt the same OEE report by hand. Two hours, gone. I dropped our line data into the OEE calculator and the gauges filled in on their own. Now the report is done before the 7 a.m. meeting and I spend that time on the floor fixing the actual losses.
 Mike R.Continuous Improvement Lead, Toledo, OH
★★★★★
My plant doesn't pay for Minitab licenses for everyone. The capability template gave me Cp and Cpk in Excel in about a minute, and the stats guide told me which chart to use. Last week I walked the customer auditor through a Gage R&R without sweating it.
 Carlos M.Quality Engineer, San Antonio, TX
★★★★★
We were counting stock on clipboards and guessing reorder points. I set up the ABC analysis and the inventory dashboard on a Saturday morning. Within three weeks we caught the two SKUs we kept running out of and moved a pallet of dead stock off the floor.
 Darnell W.Warehouse Operations Manager, Memphis, TN
★★★★★
I knew Excel, but Power BI felt like a wall. Dashboards in an Afternoon is exactly that. I followed it step by step and had a sales dashboard my manager actually opened. He asked who built it. That was a good Friday.
 Tyler B.Junior Data Analyst, Denver, CO
Build your kit
Templates like these sell for around $9 each. Pick one, pick ten, or take the whole kit and stop paying per file.
| Templates | Bought one by one |
|---|---|
| 1 template | $9 |
| 10 templates | $90 |
| 50 templates | $450 |
| 124 templates + 3 guides | |
| Lean Data Kit · today | $27 |
One payment, instant download, yours to keep. Works in Excel (Windows or Mac) and Power BI Desktop, which is free. Use them at work, with clients or for your own projects.
🛒 My order
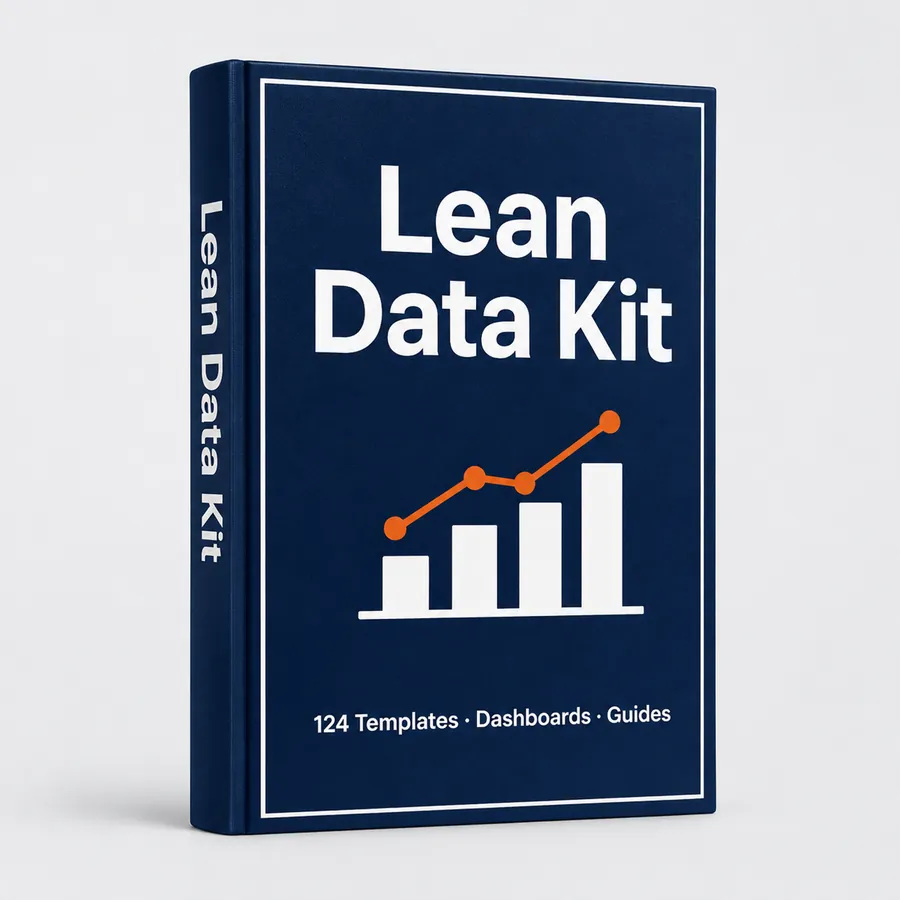
Lean Data Kit · full kit
- 124 Excel & Power BI templates
- 11 categories, from DMAIC to finance
- 3 step-by-step guides
- Lifetime access and updates
Subtotal$297.00
Discount (91%)−$270.00
Total USD$27.00
GET THE KIT · $27 →
🔒 Secure checkout · Instant access
See all 124 templates ↓Lean Six Sigma (DMAIC)
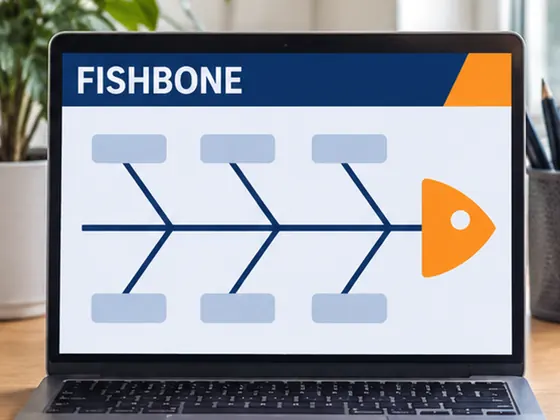
Fishbone Diagram
Lean Six Sigma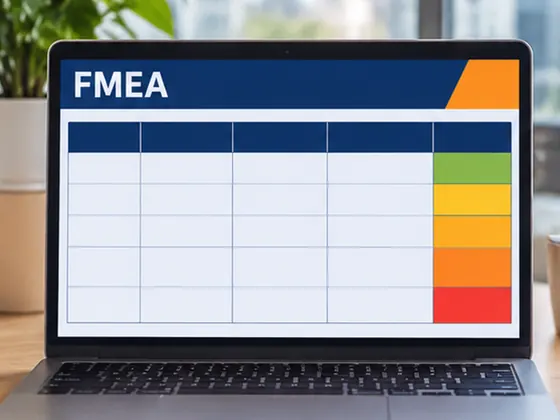
FMEA with RPN
Lean Six Sigma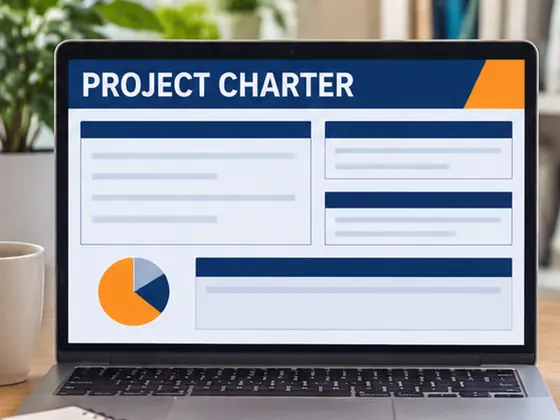
Project Charter
Lean Six SigmaLean Six Sigma (DMAIC) pack
- 12 templates
- Excel
Every DMAIC phase has its sheet, already laid out. Define the problem, map the process, rank the risks and lock in the gains without building a single form from scratch.
Also in this pack:
- 5 Whys
- Voice of the Customer
- CTQ Tree
- Control Plan
- A3 Report
- Kaizen Event Plan
- Spaghetti Diagram
- Savings Calculator
Statistics & SPC (Minitab-style)
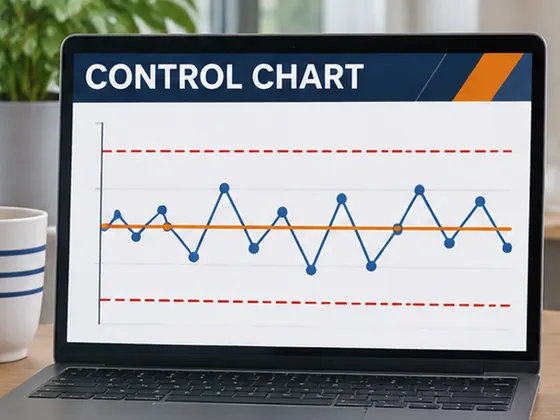
Control Charts
Stats & SPC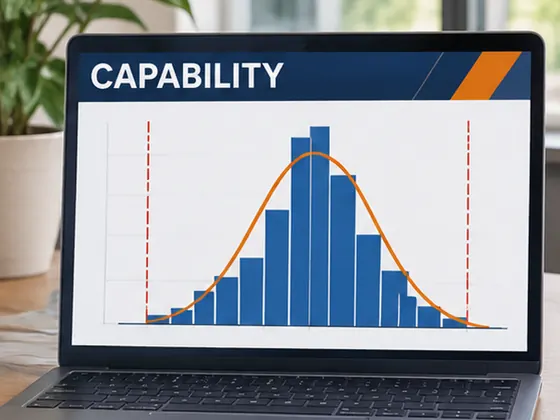
Capability Cp/Cpk
Stats & SPC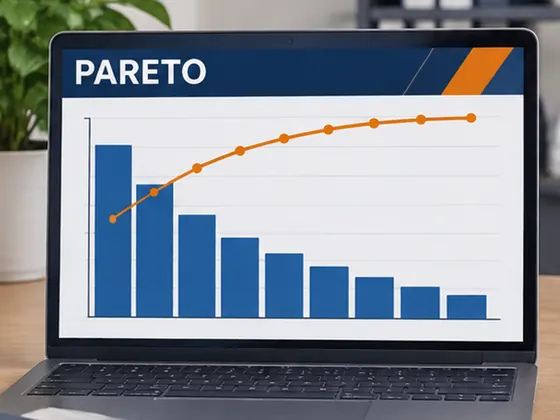
Pareto Chart
Stats & SPC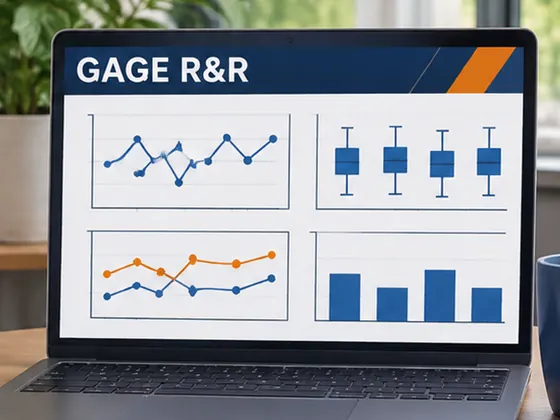
Gage R&R
Stats & SPCStatistics & SPC (Minitab-style) pack
- 12 templates
- Excel
The analyses you would run in Minitab, preformulated in Excel. Paste your data and the chart, the limits and the capability numbers fill in on their own.
Also in this pack:
- Histogram
- Scatter & Regression
- Hypothesis Test Picker
- Sample Size Calculator
- Box Plot
- Run Chart
- DPMO & Sigma Level
- Normality Check
Power BI Dashboards
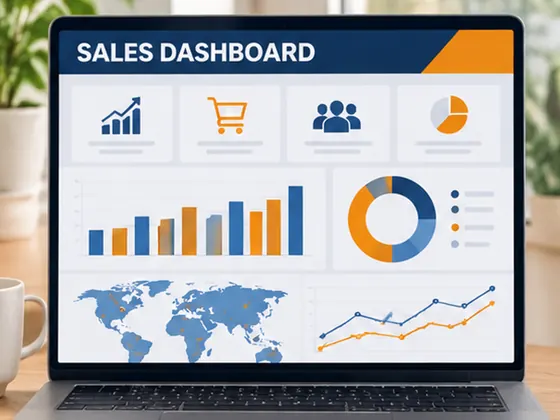
Sales Dashboard
Power BI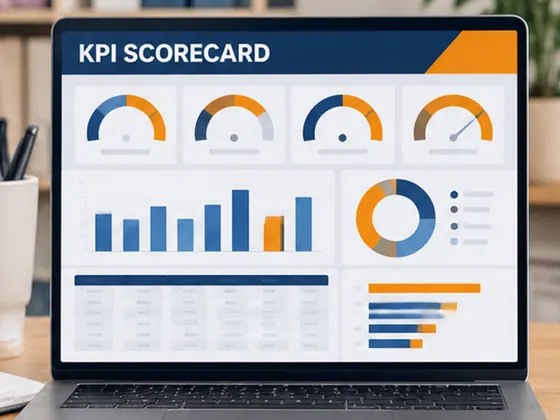
KPI Scorecard
Power BI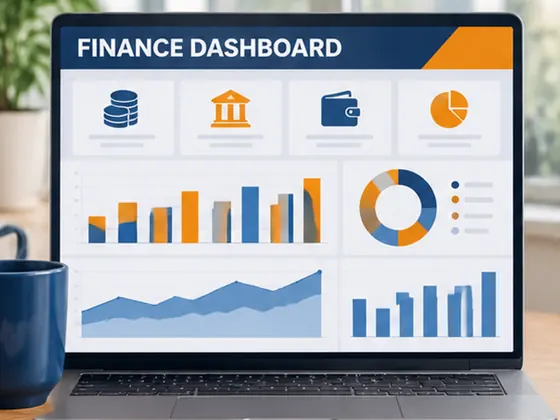
Finance Dashboard
Power BI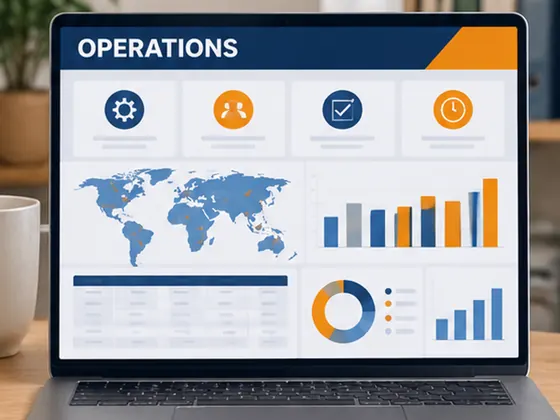
Operations
Power BIPower BI Dashboards pack
- 10 templates
- Excel + Power BI
Ready-made Power BI files with the data model, the measures and the visuals in place. Swap in your data and refresh: the dashboard is done.
Also in this pack:
- Inventory Dashboard
- HR Dashboard
- Customer Service
- Maintenance Dashboard
- Production Dashboard
- Executive Summary
Lean Operations
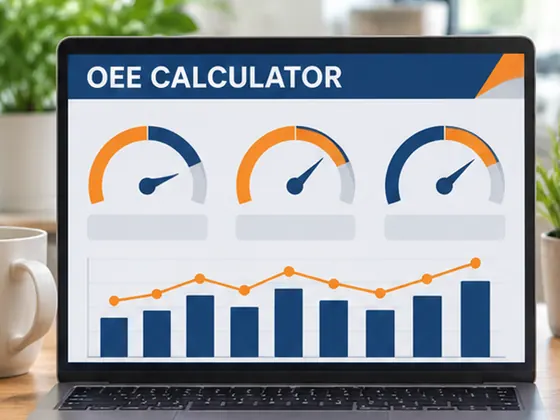
OEE Calculator
Lean Ops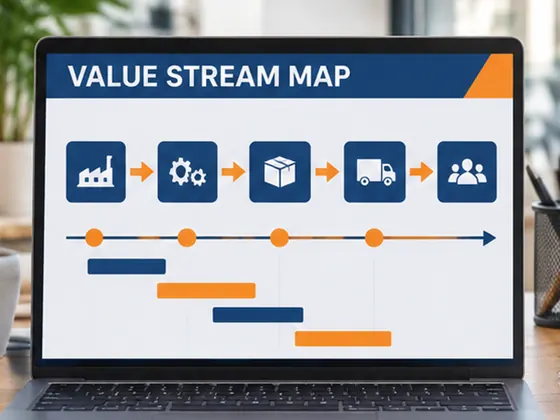
Value Stream Map
Lean Ops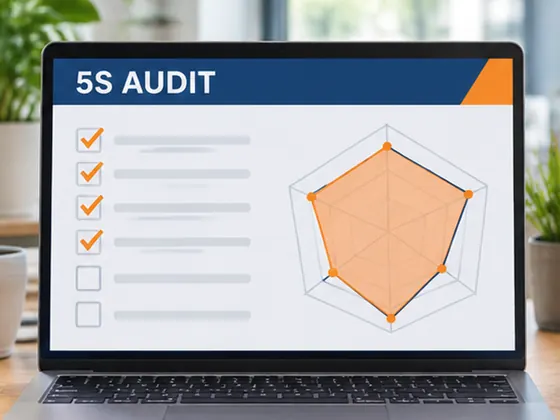
5S Audit
Lean Ops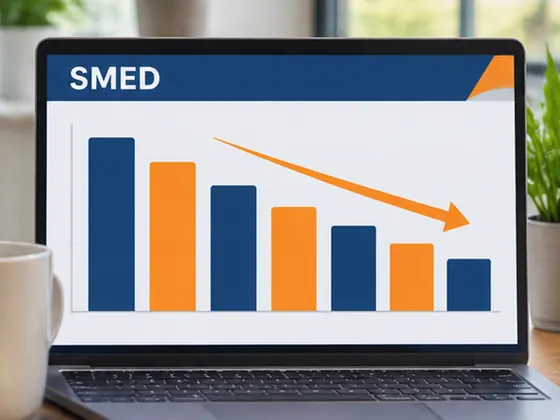
SMED Changeover
Lean OpsLean Operations pack
- 12 templates
- Excel
The shop-floor tools: OEE by line and shift, value stream maps, 5S scoring and changeover times, built to be filled in on the floor and reviewed in the meeting.
Also in this pack:
- Standard Work
- Time Study
- Takt Time
- TPM Plan
- Line Balancing
- Kanban Sizing
- Gemba Walk
- 8 Wastes Tracker
Quality
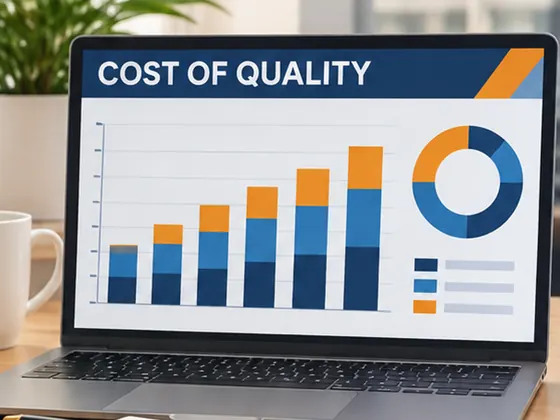
Cost of Quality
Quality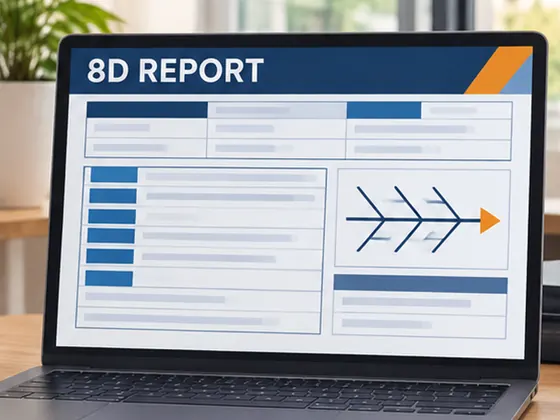
8D Report
Quality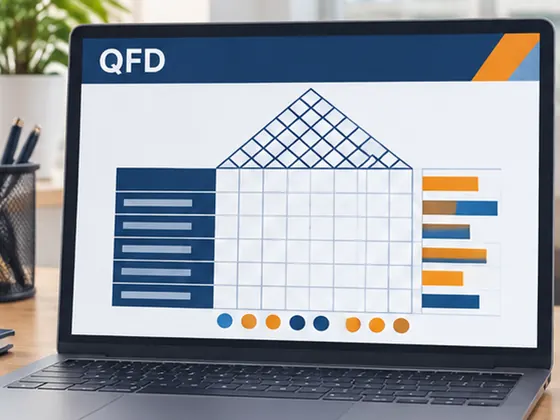
QFD Matrix
Quality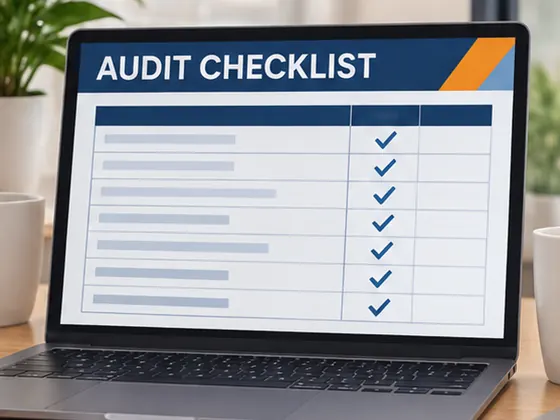
Audit Checklist
QualityQuality pack
- 10 templates
- Excel
Put a dollar figure on scrap and rework, close every complaint with a clean 8D and walk into the audit with the checklist already done.
Also in this pack:
- CAPA Log
- Supplier Quality
- Nonconformance Log
- Calibration Log
- Inspection Plan
- Customer Complaints
KPIs & Processes
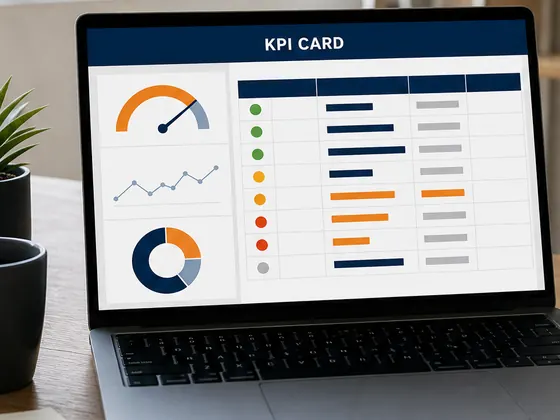
KPI Card
KPIs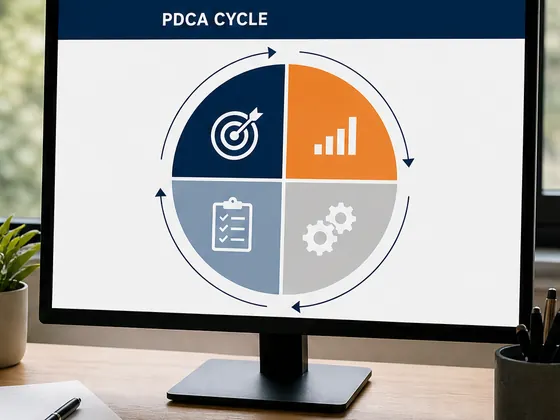
PDCA Cycle
KPIs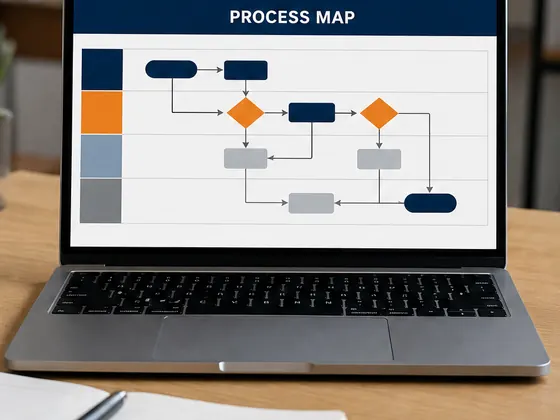
Process Map
KPIs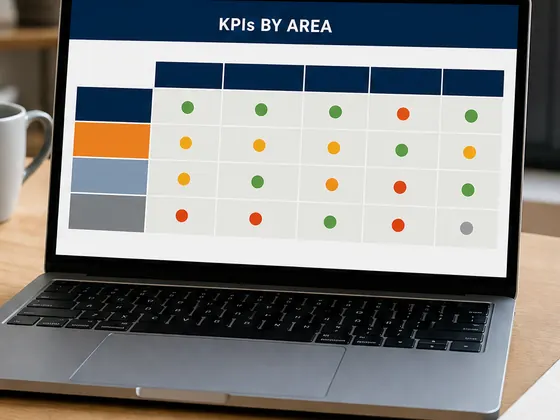
KPIs by Area
KPIsKPIs & Processes pack
- 10 templates
- Excel
Define each indicator once, with its formula, target and owner, then track it by area. The PDCA and huddle boards keep the follow-up from dying after the meeting.
Also in this pack:
- Efficiency vs Effectiveness
- Process Characterization
- Root Cause Tree
- Process Reengineering
- Daily Huddle Board
- Tier Meeting Board
Finance
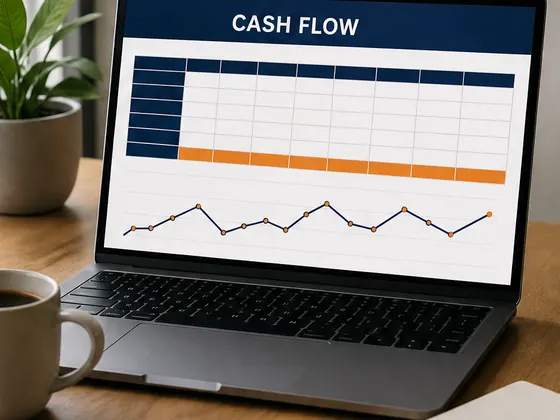
Cash Flow
Finance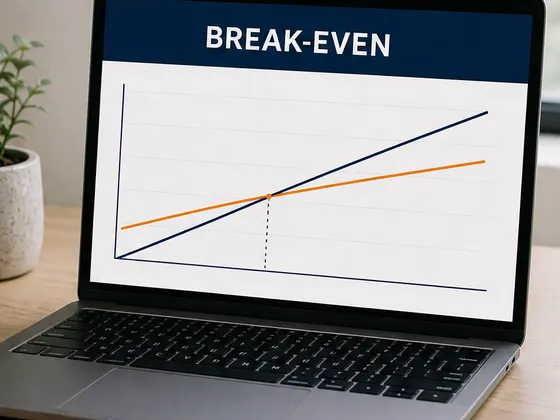
Break-Even
Finance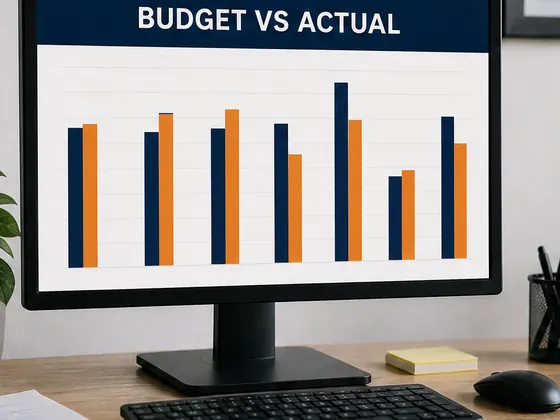
Budget vs Actual
Finance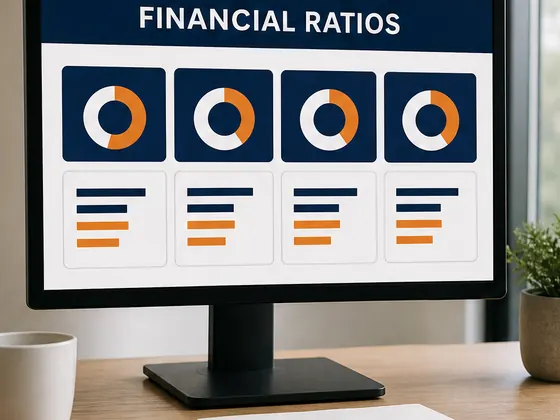
Financial Ratios
FinanceFinance pack
- 10 templates
- Excel
Show the money behind the improvement: cash flow, break-even, budget variance and the ROI sheet that gets your project approved.
Also in this pack:
- Cost Savings Tracker
- ROI Calculator
- Pricing Calculator
- Capex Request
- Statistics Dashboard
- Personal Budget
Logistics & Inventory
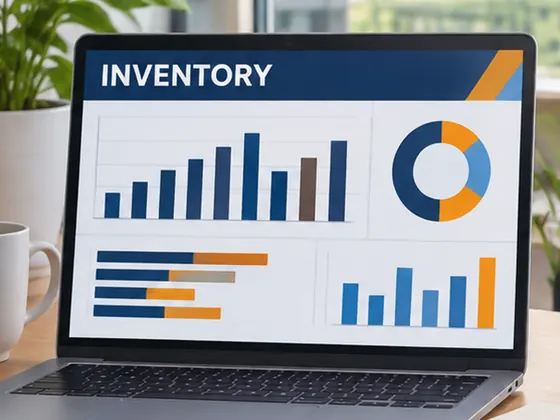
Inventory
Logistics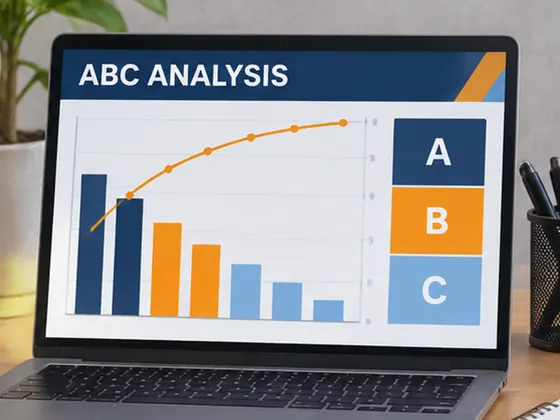
ABC Analysis
Logistics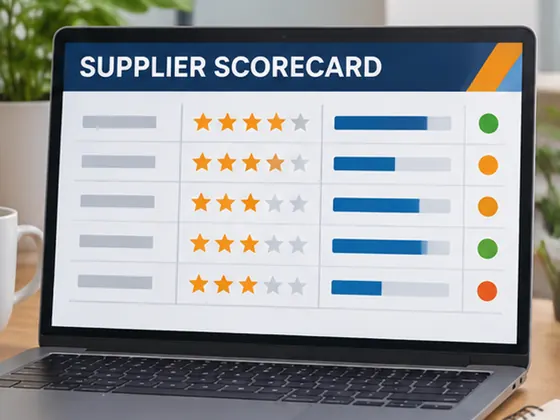
Supplier Scorecard
Logistics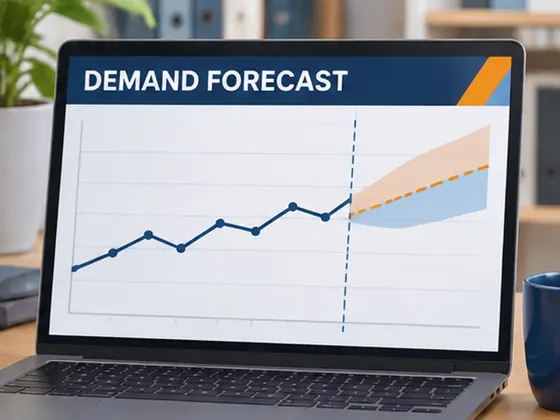
Demand Forecast
LogisticsLogistics & Inventory pack
- 12 templates
- Excel
Know what to reorder, when and from whom. ABC classes, safety stock, supplier ratings and a forecast you can defend in the S&OP meeting.
Also in this pack:
- Purchasing Dashboard
- Reorder Point & Safety Stock
- Inventory Accuracy KPI
- Warehouse Density
- Transportation Dashboard
- Lead Time Tracker
- Landed Cost Calculator
- Stock Control
Strategy
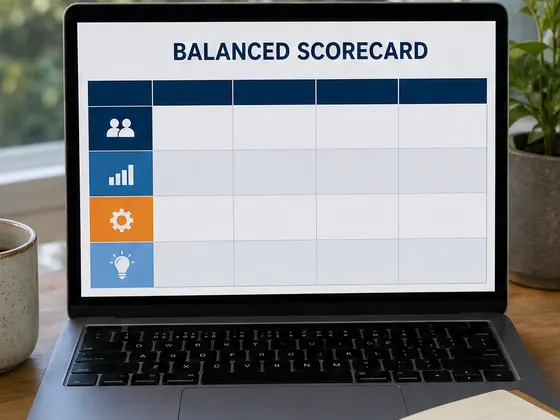
Balanced Scorecard
Strategy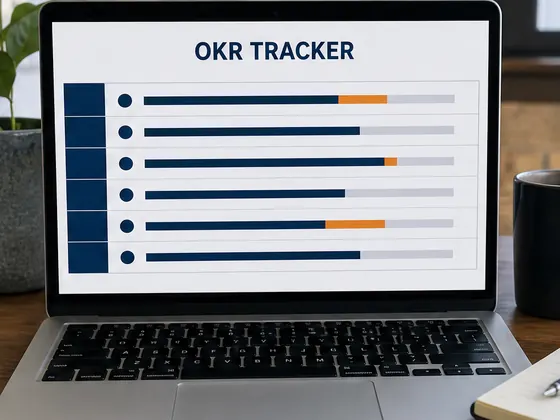
OKR Tracker
Strategy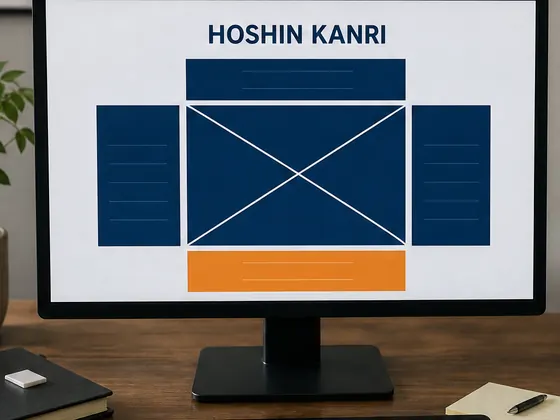
Hoshin Kanri
Strategy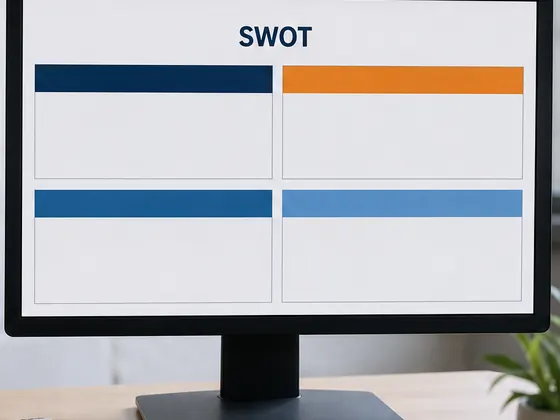
SWOT
StrategyStrategy pack
- 12 templates
- Excel
Turn the yearly plan into objectives, owners and monthly numbers. Balanced scorecard, OKRs and the Hoshin X-matrix, ready to present.
Also in this pack:
- PESTEL
- Porter's 5 Forces
- Value Chain
- Benchmarking
- SMART Goals
- Resources & Capabilities
- Strategy Map
- Value Proposition
Projects
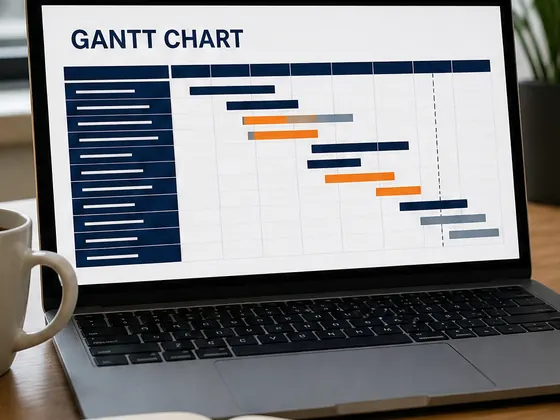
Gantt Chart
Projects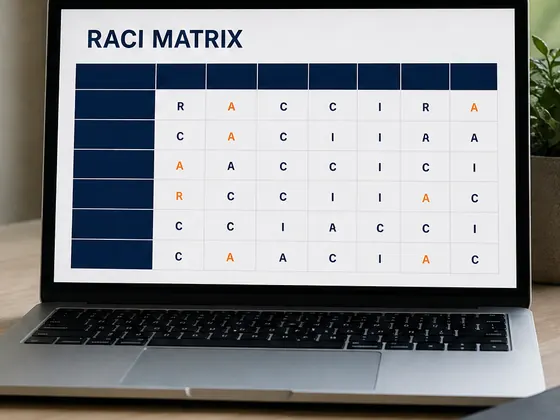
RACI Matrix
Projects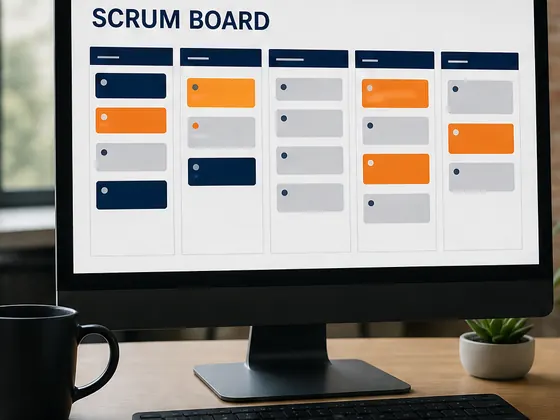
Scrum Board
Projects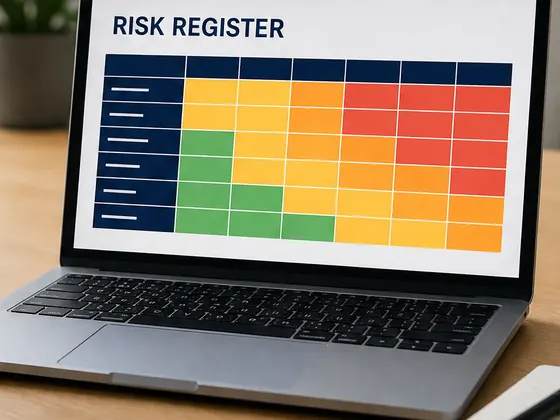
Risk Register
ProjectsProjects pack
- 12 templates
- Excel
Plan it, assign it and report it. The Gantt updates itself from the dates, the RACI ends the who-does-what argument and the status report takes ten minutes.
Also in this pack:
- Project Charter (PMBOK)
- Business Plan
- Stakeholder Map
- Lessons Learned
- Change Log
- Project Budget
- Weekly Status Report
- Resource Plan
HR, Sales & Marketing

HR Dashboard
HR & Sales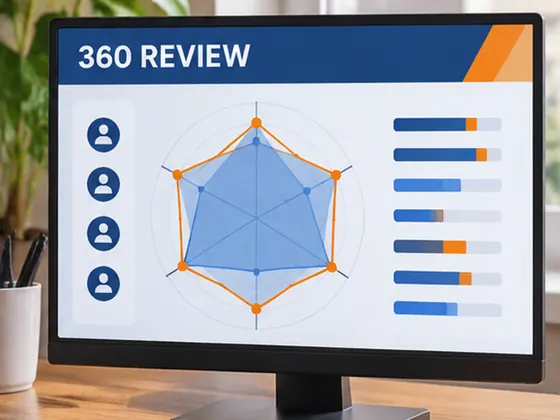
360 Review
HR & Sales
Sales Pipeline
HR & Sales
Ad Spend Tracker
HR & SalesHR, Sales & Marketing pack
- 12 templates
- Excel
Headcount, turnover and skills on one screen, plus the sales pipeline and the ad spend tracker for the teams that live on numbers too.
Also in this pack:
- Attendance & Hours
- Turnover Rate
- Employee Survey
- Skills Matrix
- Training Plan
- Content Calendar
- KANO Analysis
- Customer Satisfaction Survey
Step-by-step guides
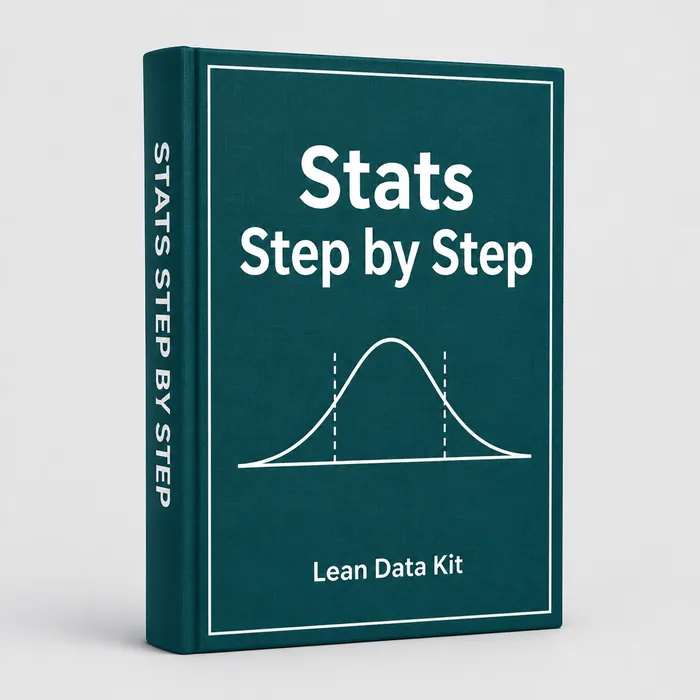
Stats Step by Step
Guide40 analyses explained click by click: which test, which chart, how to read the output and what to say in the report. Works for Excel and Minitab.
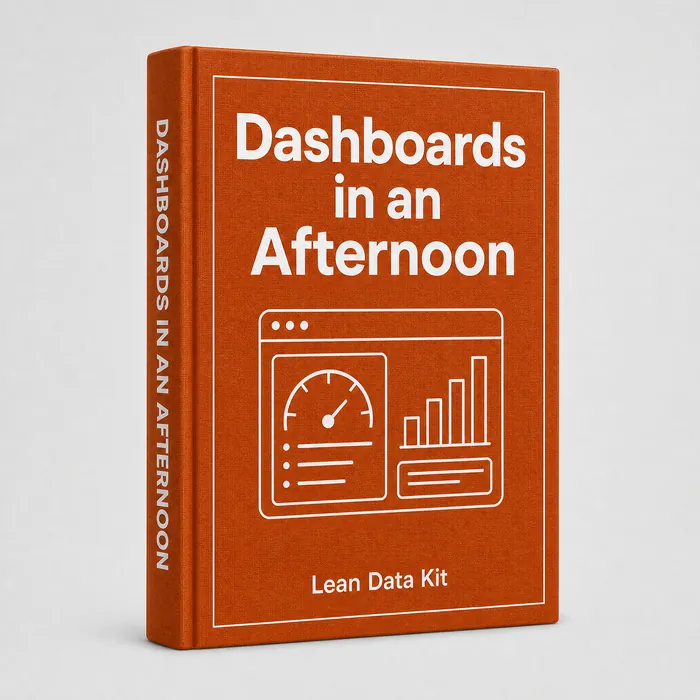
Dashboards in an Afternoon
GuideBuild your first Power BI dashboard from a blank file: import, clean, model, measures and visuals, one screenshot per step.
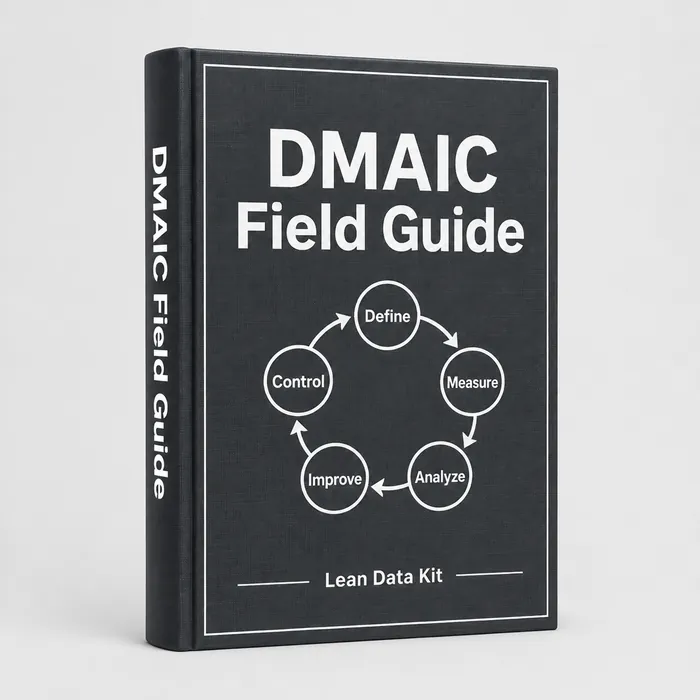
DMAIC Field Guide
GuideA Green Belt project start to finish: which template to open in each phase, what the champion expects to see and how to close it.
Guides pack
- 3 guides
The templates do the math. The guides tell you which one to open, what to paste in and how to explain the result, so nobody gets stuck on step one.
Start 2027 with your numbers under control
124 templates, 10 dashboards and 3 guides for less than the price of one hour of overtime.
GET THE KIT · $27 ↑